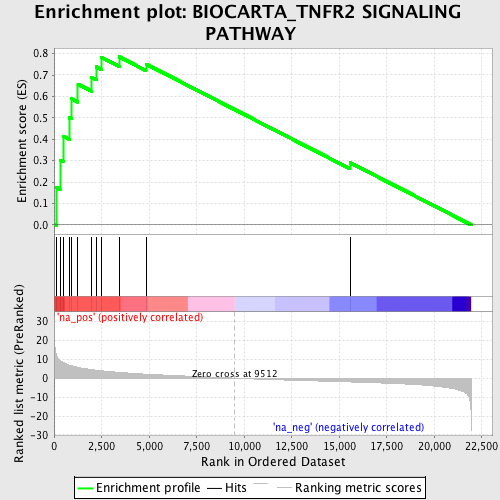
Profile of the Running ES Score & Positions of GeneSet Members on the Rank Ordered List
| Dataset | set02_BT_ATM_minus_versus_ATM_plus |
| Phenotype | NoPhenotypeAvailable |
| Upregulated in class | na_pos |
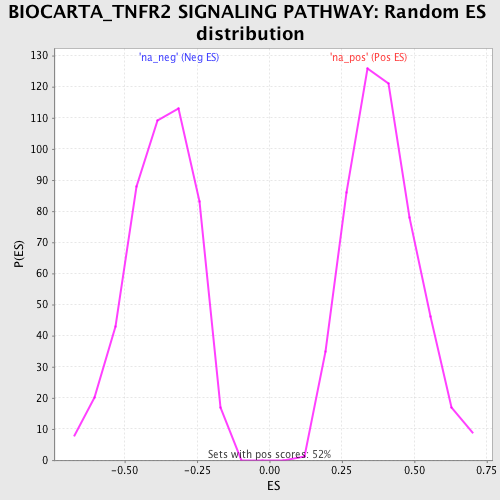
| GeneSet | BIOCARTA_TNFR2 SIGNALING PATHWAY |
| Enrichment Score (ES) | 0.7847668 |
| Normalized Enrichment Score (NES) | 2.0191061 |
| Nominal p-value | 0.0 |
| FDR q-value | 0.004799746 |
| FWER p-Value | 0.086 |
| PROBE | GENE SYMBOL | GENE_TITLE | RANK IN GENE LIST | RANK METRIC SCORE | RUNNING ES | CORE ENRICHMENT | |
|---|---|---|---|---|---|---|---|
| 1 | NFKBIA | 116 | 12.486 | 0.1751 | Yes | ||
| 2 | TRAF3 | 312 | 9.412 | 0.3022 | Yes | ||
| 3 | TNFAIP3 | 474 | 8.304 | 0.4149 | Yes | ||
| 4 | TRAF1 | 801 | 6.898 | 0.4997 | Yes | ||
| 5 | RELA | 916 | 6.549 | 0.5891 | Yes | ||
| 6 | TRAF2 | 1256 | 5.730 | 0.6564 | Yes | ||
| 7 | MAP3K14 | 1956 | 4.529 | 0.6900 | Yes | ||
| 8 | MAP3K1 | 2233 | 4.194 | 0.7380 | Yes | ||
| 9 | TNFRSF1B | 2492 | 3.901 | 0.7826 | Yes | ||
| 10 | TANK | 3424 | 3.086 | 0.7848 | Yes | ||
| 11 | LTA | 4836 | 2.132 | 0.7512 | No | ||
| 12 | RIPK1 | 15573 | -1.990 | 0.2906 | No |